Solar Technology for the Home
| Main Menu |
| Home |
| Solar |
| Automation |
| Lighting |
| Office |
| Computers |
| Internet |
| Telephone |
| Cellphones |
| Security |
| Audio/Visual |
| Landscape |
| Maintenance |
| Mobile |
| Web Site |
| CONTACT US |
| PRIVACY POLICY |
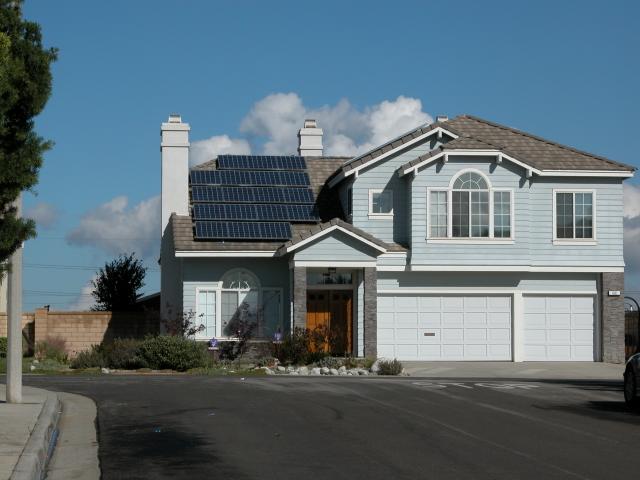
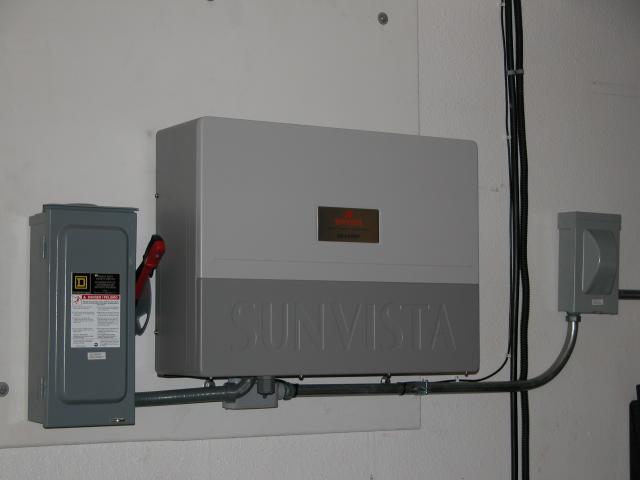
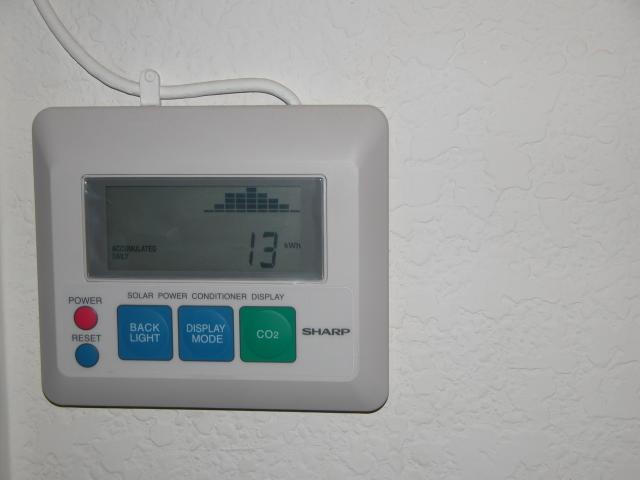
My installation consist of 27 Kyocera 158 watt solar modules, 18 mounted facing south (visible in the picture above), and 9 facing west. I am using a single Sharp Sunvista 3.5Kw inverter (below left) to connect my panels to the grid. A remotely mounted display (below right) allows monitoring of the system from inside the house. The marketing literature for the inverter mentions an option to allow network monitoring, but I have been unable to find any information on this option to date. Please send me a message if you know the details of this option.
The system was planned and installed by EE Solar (http://www.eesolar.com) and I highly recommend them for anyone considering installing a solar system in Southern California. They did a great job, paying careful attention to both function and Aesthetics. If you contact them, tell them you were referred from this site, as opposed to one of the manufactures site. That way they will be able to pick the components for your system that best meet your needs (if you were referred by an equipment manufacturer, they would be bound to use equipment from that manufacturer).
Costs
The final installed cost of my system after rebates and credits was around $10,500. The costs, and credits are slightly different now, compensated for in part by reductions in in the technology costs. Outside California, the credits would be completely different if available at all. The availability of rebates within California may vary depending on your utility provider.The cost of the system including installation was around $25,000 with approximately half that cost covered by the State of California. An additional $1,500 was received as an income tax credit. The payback time for such a system works out to approximately 8 years. The expected life of the system is expected to be greater than 25 years and the system is essentially maintenance free. A system that used batteries would cost more and the batteries would require maintenance; tying the system to the grid reduces the costs and eliminates most mainenance. Because of the California net metering laws the cost to tie to the grid is essentially $20 per year for the basic and minimum charge from Southern California Edison.
If I were to generate less power than I consume, I could switch to time of use metering, feeding power into the grid during the day at higher rates, and draw it out at night when the rates are cheaper. This would lower my net electric bill, but the benefit would be offset slightly by a higher "basic" charge. California utilities are required to "net" use over the course of a year, but under the net metering rate schedules they do not pay for net annual generation, only using it to offset net consumption, as such if one already generates more power than used, switching to time-of-use metering does not make sense, and will only raise ones "basic" charge.
Generation and Consumption by Month
Generation and consumption varies by month. My system generates more power in the summer because the days are longer. Since I live on the west side of LA, which is cooler, I consume more power in winter for lighting. If I lived in a warmer part of LA, my summer usage woule be higher for air conditioning. The table below shows my generation and consumption by month for the period from January 2004 through February 2005. My net use for 2004 (consumption less generation) was approximatly zero.
| 2004 | 2005 | |||||
| Month | Generation | Consumption | Net Use | Generation | Consumption | Net Use |
| January | 373 | 524 | 151 | 294 | 455 | 161 |
| February | 365 | 428 | 63 | 313 | 388 | 75 |
| March | 491 | 472 | -19 | 442 | 400 | -42 |
| April | 515 | 449 | -66 | 562 | 381 | -181 |
| May | 582 | 471 | -111 | 578 | 403 | -175 |
| June | 500 | 457 | -43 | 567 | 389 | -178 |
| July | 599 | 436 | -163 | 605 | 412 | -193 |
| August | 586 | 457 | -129 | 584 | 484 | -100 |
| September | 482 | 470 | -12 | 512 | 473 | -39 |
| October | 403 | 433 | 30 | 382 | 475 | 93 |
| November | 370 | 400 | 30 | 0 | 0 | 0 |
| December | 307 | 512 | 205 | 0 | 0 | 0 |
| Total | 5573 | 5509 | -64 | 0 | 0 | 0 |
Maintenance
My system is essentially maintenance free. Since I use the grid to store power I avoid the need to maintain the batteries that would be used otherwise. The only maintenance I have performed is to occasionally clean the panels. This is not absolutely necessary, as heavy rains will do a pretty good job removing the dust that accumulates, but since I live in Southern California where we can go for nine or ten months between rains, I have found that dirt accumulation on the panels can cut power generation by about one Kwh per day (about 5% in the summer).What has worked for me (for liability reasons, I am not suggesting that you do the same, instead ask your installer for advice), is to mix a bucket of car wash detergent and to use a window washing scrubber on the end of a long pole to clean the panels. I climbed out onto my roof to do this, using the pole to reach the far ends of the panels. When done, I sprayed the panels down with a hose and let them air dry.
Links - For more information on solar power
You can find useful information on Solar Power from the following sites.- California Energy Commission - Emerging Renewables Program rebates
- EE Solar Website - A recomended contractor for installing solar systems in California.
- Solar Electric Power Association - Information from a Solar Power industry association
- Home Power Magazine - A renewable energy magazine
- The American Solar Energy Society - Useful information on alterative energy
- U of Oregon Solar Radiation Monitoring Laboratory - Tools and information for planning solar systems.
- Solar Daily - News about Solar Power
- CirKits - Links to Solar Energy Web sites
- The Hazards of Solar Powers - Before deciding on solar power, consider the hazards (satire)
News Articles of Interest
- LA Times, March 13, 2005 - Skies to Brighten for Solar (LA Times registration required)
| |||||

| ||||